7.2 Plotting Simple Functions
Real functions with one real parameter can be plotted by simply
adding them to the plotter.
Suitable equations and formulae are promoted to function and lambda definitions
when plotted. The formula


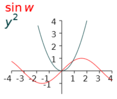
A function's domain
is represented on the horizontal axis of the plot and the value of the
function at each horizontal point is represented on the vertical axis.
This generalizes the normal idea of the x and y axes to parameter and
function axes. As a result, it is possible to plot two functions like